
Recycling Waste Characterization Study in Pittsburg, CA
Client: City of Pittsburg, CA
Date: Spring 2019 Highlights √ Sorting staff of 6 sorted 30 samples of approximately 250 pounds each into 27 categories over the course of 2 weeks √ The findings will be utilized to inform future facility upgrades and equipment purchasing in response to the prevalence of materials in the material recovery facility (MRF) material stream. √ 7,393.7 lbs. of material were sorted and categorized for inclusion in the project. Introduction
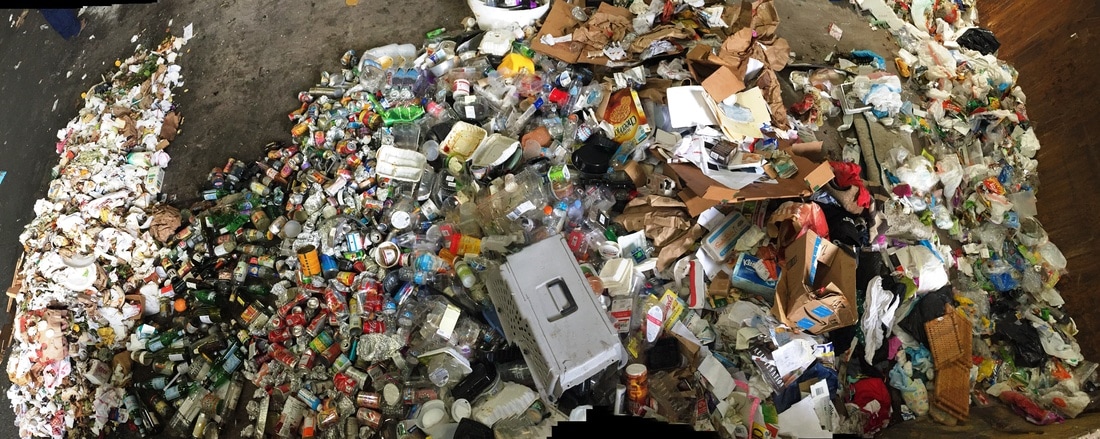
Envirolutions Consulting, LLC conducted a waste characterization study of the inbound loads received by a privately-held MRF in Pittsburg, CA. The purpose of the waste characterization was to determine the relative percentages and volume of material types received through a representative sample of materials received as inbound recycling loads at the facility. The study did not attempt to control the point of origin or sector (residential, multifamily or commercial) but rather to sample inbound materials overall. The intended use for the results of this characterization are to extrapolate from these findings and provide to future material recycling facility (MRF) equipment manufacturers a snapshot of what materials are being received. This will be useful in prioritizing what new equipment and sorting technologies investments based on what is anticipated to be received at the MRF. |
Activity
The waste characterization spanned 3 collection days; 40 of Sausalito’s 52 eligible MFDs sites were sampled. Envirolutions Consulting staff sorted 13 samples of approximately 250 pounds each (3,273.8 lbs. total) into 9 categories and placed the material into barrels to be weighed. The 9 categories included: recyclable paper, recyclable plastics, compostable organics, non-compostable organics, electronics, recyclable metal, recyclable glass, household hazardous waste, and other waste (or mixed residue). Results Overall 15.5% of the materials sampled during the characterization were categorized as non-recoverable garbage. When combined with the other contaminant categories (e-waste, household waste (HHW), food and food-soiled paper and contaminated containers that would be too dirty to market), this number was 22.0%. When we analyze the data by the larger material categories of paper, plastic, glass, metal and contaminants, the largest percentage of the meta-material categories received is paper at 59.1%. The second most prominent category is the contaminants, which included garbage e-waste, yard waste, household hazardous waste (HHW), food and food-soiled paper and contaminated containers that would be too dirty to market. 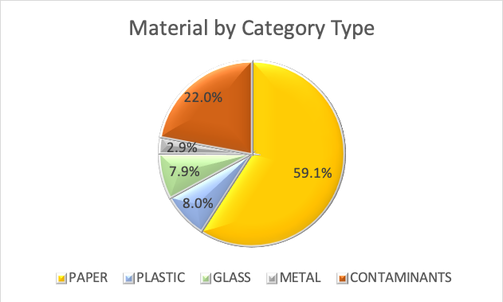
|
